By embedding sustainability throughout our global operations, we aim to create lasting positive change and contribute to a healthier, more resilient planet.
In 2021, we committed to year-on-year reductions in our total direct and indirect greenhouse gas (“GHG”) emissions. We are targeting net zero scope 1 and market-based scope 2 emissions by 2035, and organisational net zero across our full value chain of scope 3 categories by 2050.
In 2024, we successfully implemented a new corporate sustainability software platform to enhance the accuracy and granularity of our GHG emissions data across Scopes 1, 2, and 3. Building on this foundation, we are continuing to expand and improve the platform’s capabilities in 2025 to further support our emissions tracking, reporting, and decision-making processes.
In parallel, we have implemented and continue to implement a wide range of short, medium, and long-term initiatives aimed at improving energy and water efficiency, reducing waste, and cutting CO₂e emissions. These efforts include upgrading equipment, optimising processes, and adopting low-carbon technologies.
SWIPE LEFT
In accordance with the GHG Protocol’s guidance on organisational boundaries and our basis of reporting, we have removed three leased office locations, two in the United States and one in the United Kingdom from our scope 1 and 2 emissions inventories, as these facilities do not fall within our operational control. As such, emissions associated with these offices will no longer be reported under direct or energy-related indirect emissions. Instead, these activities will be accounted for under scope 3, category 8 (Upstream Leased Assets), reflecting our commitment to accurate and transparent reporting we have restated the 2022 base year figures, which has resulted in total scope 1 and 2 market-based emissions decreasing to 19,249 tCO2e (previously published at 19,175 tCO2e) and this figure has been assured by ERM CVS, an independent third party organisation. All references to 2022 base year figures in the annual report refer to restated figures. For more information, please refer to our Basis of Reporting.
We engaged ERM CVS to provide independent limited assurance over our 2025 total scope 1 and total scope 2 location-based GHG emissions, as well as our total scope 2 market-based GHG emissions. ERM CVS also provided assurance over our scope 3 emissions for Category 3 (Fuel- and energy-related activities),Category 6 (Business travel) and Category 9 (Downstream transportation and distribution). Their independent assurance report can be found on (pages 14 to 15)of our sustainability report 2025.
1 Group revenue for 2025 and 2024 differs to the Group revenue disclosed in the consolidated income statement of £497.5m and £488.3m respectively due to the inclusion of Alloy Surfaces Company, Inc.. Under the GHG Protocol control approach, emissions are reported from operations over which the Group maintains control. In line with the GHG Protocol, closures or reductions in activity from facilities the Group owns or controls are treated as organic decline and do not trigger a base-year emissions recalculation; instead, these changes are reflected as part of the Group’s ongoing emissions profile.
Scope 3 carbon data collection
Land quality and regulatory compliance
Our facility in Chicago, US, is located on a designated Comprehensive Environmental Response, Compensation, and Liability Act (“CERCLA”) “Superfund” site. The business continues to collaborate closely with environmental consultants and regulatory authorities to ensure full compliance with all legal obligations related to this designation.
Additionally, we have incurred costs associated with the environmental remediation of former munitions business sites previously owned by the Group in Belgium and Italy, as required under the terms of sale for those businesses. The Group maintains a provision of £3.4m (2024: £3.5m) for environmental liabilities, which the Board considers to be adequate.
Waste Generation and Management
In 2025, we continued to enhance the accuracy, transparency, and reliability of our reporting processes through further improvements to our waste collection recording system across all business units. This initiative is evolving year by year, enabling us to build a more comprehensive and detailed understanding of our waste streams. As our monitoring and data capture methods become more robust, we are better able to identify the types, sources, and volumes of waste generated within our operations. While this enhanced monitoring has led to an increase in reported waste volumes compared with 2024, the figures now provide a more accurate and transparent representation of the true scale and nature of the waste we produce. These insights are helping us to better target reduction initiatives, drive efficiency, and support our broader sustainability objectives.
A key achievement in 2025 was that only 13% of our total waste was sent to landfill or incineration, representing a 1% reduction compared with 2024. This displays our efforts to minimise non-beneficial waste disposal and reflects our growing commitment to circular economy practices.
Waste Performance Data
The table below highlights the breakdown of waste types and treatment pathways across our main regions of operation:
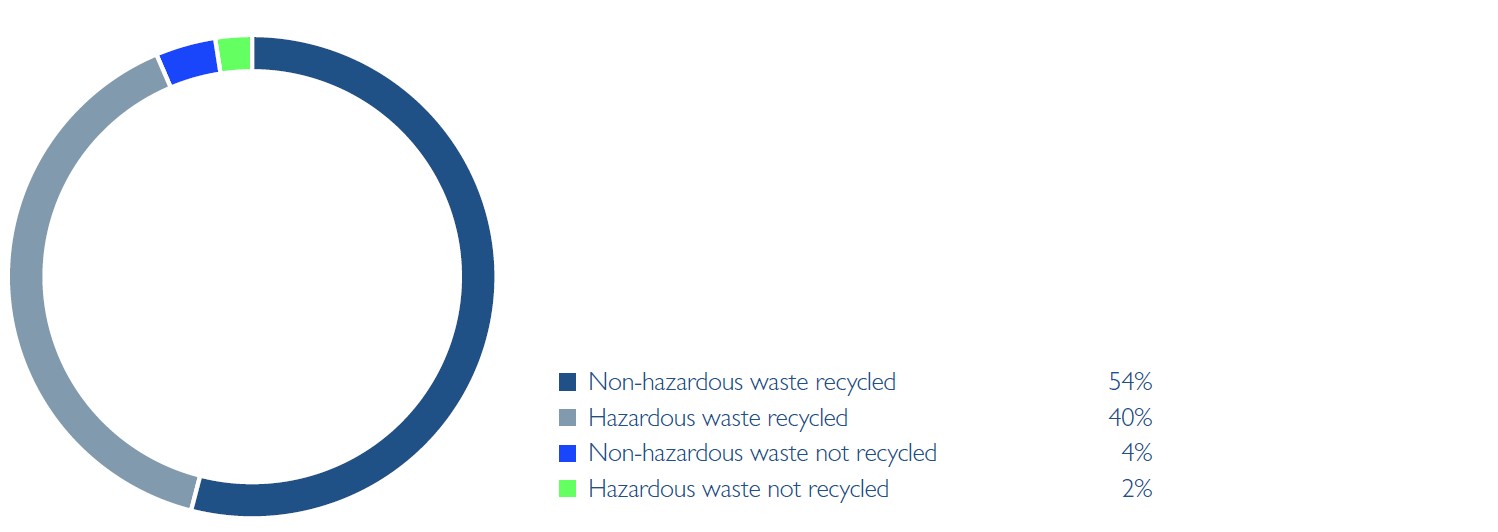
The increase in total waste tonnage between 2024 and 2025 is primarily attributable to the improved recording processes introduced last year, rather than a significant rise in underlying waste generation. Importantly, despite capturing more data, we have reduced the proportion of waste requiring landfill or incineration.
Waste Characteristics and Treatment
Certain operations, particularly within our Countermeasures & Energetics businesses, produce highly specialised waste streams. These materials often require unique disposal methods to ensure safe handling and compliance with regulatory requirements. In many cases, the most effective and responsible solution is destruction through on-site treatment facilities. This ensures safety while reducing reliance on third-party waste disposal services.
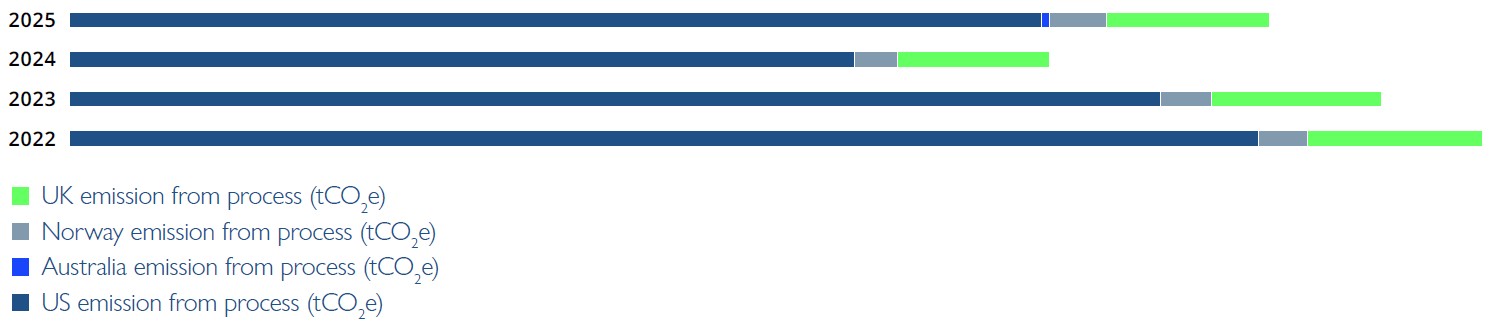
Between 2020 and 2025, process emissions across our operations continued to trend downward, with total emissions falling from around 227 tonnes in 2022 to just over 193 tonnes in 2025. The most substantial long-term reductions were achieved in the United States, where emissions declined significantly between 2022 and 2024 before partially rising again in 2025 while remaining well below 2022 levels. Australia, Norway, and the UK showed relatively small year-to-year variations but maintained overall stable performance. These results reflect the impact of our initiatives to strengthen monitoring, streamline processes, and reduce waste at the source, contributing to more efficient and sustainable operations over time.
Our Priorities in Waste Management
Our waste management strategy is guided by two clear priorities:
- Reducing total waste generation across all operations.
- Minimising waste sent to landfill or incineration, ensuring that as much material as possible is either recycled, reused, or treated in ways that create beneficial outcomes.
To deliver against these priorities, we are actively engaging with the end destinations of our waste to confirm that materials are being processed using the most advanced and responsible methods available. This includes working closely with waste management partners to identify opportunities for higher-value recycling, recovery, and reprocessing.
Looking Ahead
As we gain more insights from this improved engagement and data collection process, we will continue refining our waste reduction plans. Our focus remains on driving continuous improvement in waste management practices, reducing reliance on landfill, and maximising the recovery of resources in line with circular economy principles.
By embedding these practices, we are not only reducing our environmental impact but also contributing to broader sustainability goals that benefit both our business and the communities in which we operate.
Water Management
In 2025, we strengthened our approach to water stewardship by enhancing the way we record, monitor, and analyse water use across our operations. The improved tracking system has given us a clearer understanding of how water is consumed, treated, and discharged in each of our facilities. This more comprehensive data enables us to identify areas of high usage, opportunities for efficiency, and risks associated with water scarcity.
Regional Water Use
Given that water availability and stress levels vary significantly by geography, we regularly assess our global operations using the United Nations’ water stress data. Based on the most recent analysis, we currently have no sites located in areas classified as critical, high, or medium water stressed. We continue to monitor and update this assessment to ensure our operations remain aligned with evolving water risk conditions.
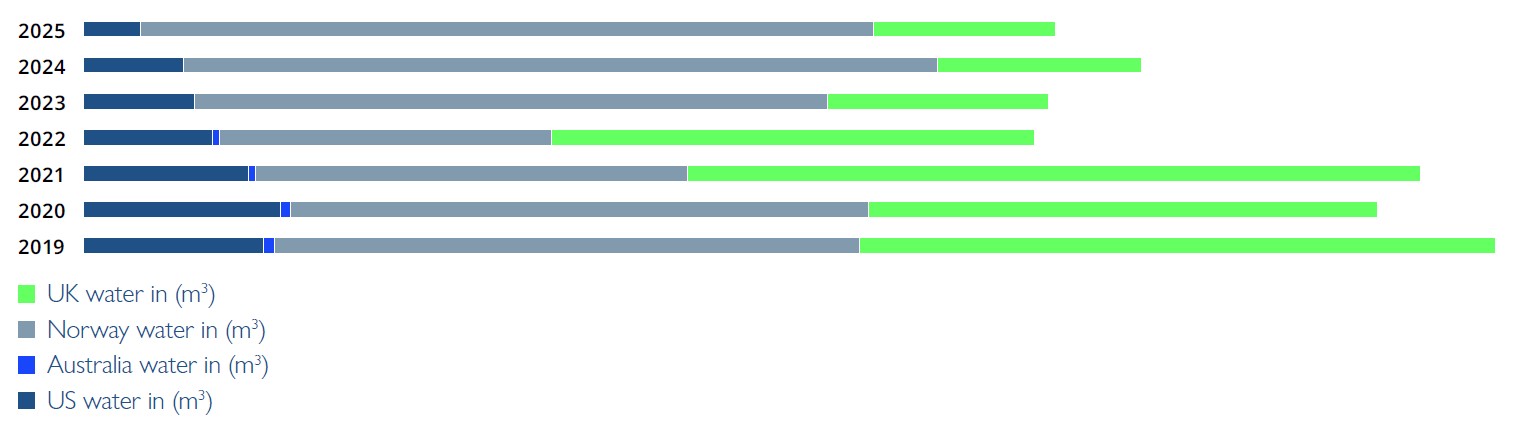
The chart shows our total water consumption across operations in the US, Australia, Norway, and the UK from 2019 to 2025. Over this period, overall water use has declined markedly—from roughly 1.28 million m³ in 2019 to under 880,000 m³ in 2025 demonstrating the continuing impact of our water-reduction initiatives. In the UK, consumption has decreased substantially, with levels falling by more than two-thirds since 2019 as a result of targeted efficiency measures and improvements in facility operations. Norway remains one of our highest-demand regions due to the scale of our activities, and while usage fluctuated year to year, it remains lower than 2019 levels despite operational growth. Australia shows relatively small but consistent variations over time, reflecting local conservation programs and increased water-reuse practices. In the US, water consumption has dropped significantly from more than 160,000 m³ in 2019 to just over 47,000 m³ in 2025 highlighting strong progress in process optimisation and resource efficiency. We remain committed to continuous improvement across all regions, supporting responsible water stewardship and long-term resource resilience.
Energy Efficiency
In 2025, we advanced our focus on energy management by implementing more robust monitoring systems and efficiency initiatives across our facilities. These improvements have provided greater transparency around electricity consumption patterns and allowed us to target specific areas for reduction. By doing so, we not only lower our operational costs but also significantly reduce our greenhouse gas (GHG) emissions associated with electricity use.
Our approach to electricity management is guided by three key strategies:
- Electrification of operations – Shifting our processes, equipment, and building systems to electric alternatives to reduce reliance on fossil fuels.
- Energy efficiency improvements – Optimising energy use per unit of output so that business growth does not lead to proportional increases in electricity consumption.
- Renewable energy sourcing – Prioritising the adoption of renewable electricity wherever feasible, supporting our broader decarbonisation objectives.
Sustainability initiatives and projects
Beyond tracking and reporting performance, we are taking concrete action across our business to reduce environmental impacts, improve efficiency, and build a culture of sustainability. Our initiatives span waste, energy, water, biodiversity, and employee engagement, reflecting a holistic approach to environmental management.
Key Initiatives in 2025
1. Waste Reduction and Circular Economy
Airline Replacement
Several sites undertook comprehensive programme to replace outdated and inefficient compressed air systems across key operations. These upgrades significantly reduced electricity consumption by improving system efficiency and minimising air leakage. In addition to lowering energy costs and carbon emissions, the new systems have enhanced operational reliability by reducing equipment downtime, leading to improved productivity and less material waste.
Recycling Improvements
Recycling processes were strengthened through the introduction of expanded waste segregation at the source. This initiative improved the capture and sorting of recyclable materials, with a particular focus on hazardous waste streams that require specialised handling.
Acetic Acid Recycling Facility Development
The site has completed feasibility studies for a new acetic acid recycling facility and initiated emission mapping to assess its carbon footprint. Once operational, the system will significantly reduce chemical waste, improve resource recovery, and enhance circularity in production processes.
Elimination of On-Site Burning
One of our BU has made a significant environmental improvement by discontinuing the on-site burning of a specialised waste steam. This waste stream is now being sent to Waste-to-Energy (WTE) disposal facilities. This change prevents the release of harmful particulates into the atmosphere, aligns with best environmental practices, and ensures supports our emission reduction targets. It also demonstrates a shift toward more sustainable and traceable waste management methods.
Transition from Plastic to Paper Tapes
One of our BUs has successfully eliminated the use of plastic tapes, replacing them with paper-based alternatives. This simple yet impactful change has significantly reduced the site’s plastic waste footprint and aligns with broader intentions to reduce plastic consumption across operations.
2. Energy Efficiency and Carbon Reduction
Facility Upgrades - Lighting
A series of facility enhancement projects were undertaken to improve energy efficiency and reduce carbon emissions. Traditional lighting systems were retrofitted with energy-efficient LED technology, providing superior illumination while significantly lowering power consumption.
Facility Upgrades – Air Conditioning
As part of ongoing facility enhancement initiatives, several sites have upgraded their air conditioning systems to improve energy efficiency and reduce greenhouse gas emissions. Older units were replaced with modern, high-efficiency models designed to optimise cooling performance while consuming less electricity. In addition, systems were re-specified to operate with next-generation, low-global-warming-potential (GWP) refrigerants, significantly reducing the environmental impact associated with traditional air-conditioning gases. These improvements have enhanced indoor comfort, lowered operational costs, and contributed to the broader carbon reduction goals.
ISO 50001 Energy Management Implementation
A Business Unit has initiated the process of assessing the feasibility and gap analysis of ISO 50001 Energy Management System. This certification would aid in formalising energy efficiency practices, ensuring continuous monitoring, benchmarking, and improvement in energy performance across all operations.
3. Water Stewardship
Monitoring Systems
Digital water metering systems were installed to provide real-time data on water use. These smart meters enable continuous monitoring and trend analysis, helping identify leaks, inefficiencies, and abnormal usage patterns. The enhanced visibility supports proactive maintenance and more accurate reporting, ensuring water resources are managed responsibly and in alignment with conservation targets.
Water Efficiency and Leak Reduction
Two of our BUs has addressed a long-standing water inefficiency by upgrading and repairing site water pipes. These projects resulted in a significant reduction of water usage compared to the previous reporting period. The improvements not only reduce the operational water footprint but also minimises potential leaks that could cause structural or environmental damage over time.
Recycling and Reuse
Water recycling and reuse initiatives were expanded through the implementation of closed-loop systems. These systems allow process water to be treated and reused multiple times, significantly reducing reliance on freshwater sources. By maximising internal water recovery, has lowered total withdrawals and reduced the environmental impact associated with water intensive operations.
4. Biodiversity
Tree Protection and Maintenance
Continuous management and safeguarding of hundreds Tree covered by Tree Protection Orders (TPOs). In compliance with local environmental regulations. All protected trees are regularly surveyed by qualified arborists to assess their health, stability, and potential risks. Maintenance activities including pruning, crown reduction, and removal of diseased or dead branches are carried out carefully to promote healthy growth while ensuring safety and structural integrity.
5. Awareness and Engagement
Employee Training
All site provided environmental training which provides knowledge and practical skills needed to support environmental goals in their daily work. Training sessions covered topics such as energy efficiency, waste reduction and water conservation. By fostering a deeper understanding of the company’s sustainability objectives, employees are empowered to take ownership of environmental performance at both individual and team levels, driving meaningful behavioural change across the organisation.
Green Network
The Green Team, was established to encourage employee led sustainability initiatives. These volunteer groups act as local sustainability ambassadors, identifying opportunities for improvement and implementing projects that promote resource efficiency and environmental stewardship. The network also facilitates knowledge sharing and collaboration between sites, ensuring that best practices are consistently adopted and celebrated. This grassroots approach has strengthened employee engagement and embedded sustainability within the Groups culture.
Composting and Zero Waste Programs
One of our BUs launched several engagement-driven sustainability programs, including a composting initiative, an Earth Day partnership with a local Elementary School, and a Zero Waste Day event. These activities aim to foster community awareness, enhance recycling rates, and promote a culture of environmental responsibility among employees.